Ollama tool calling is the local-model risk no benchmark measures
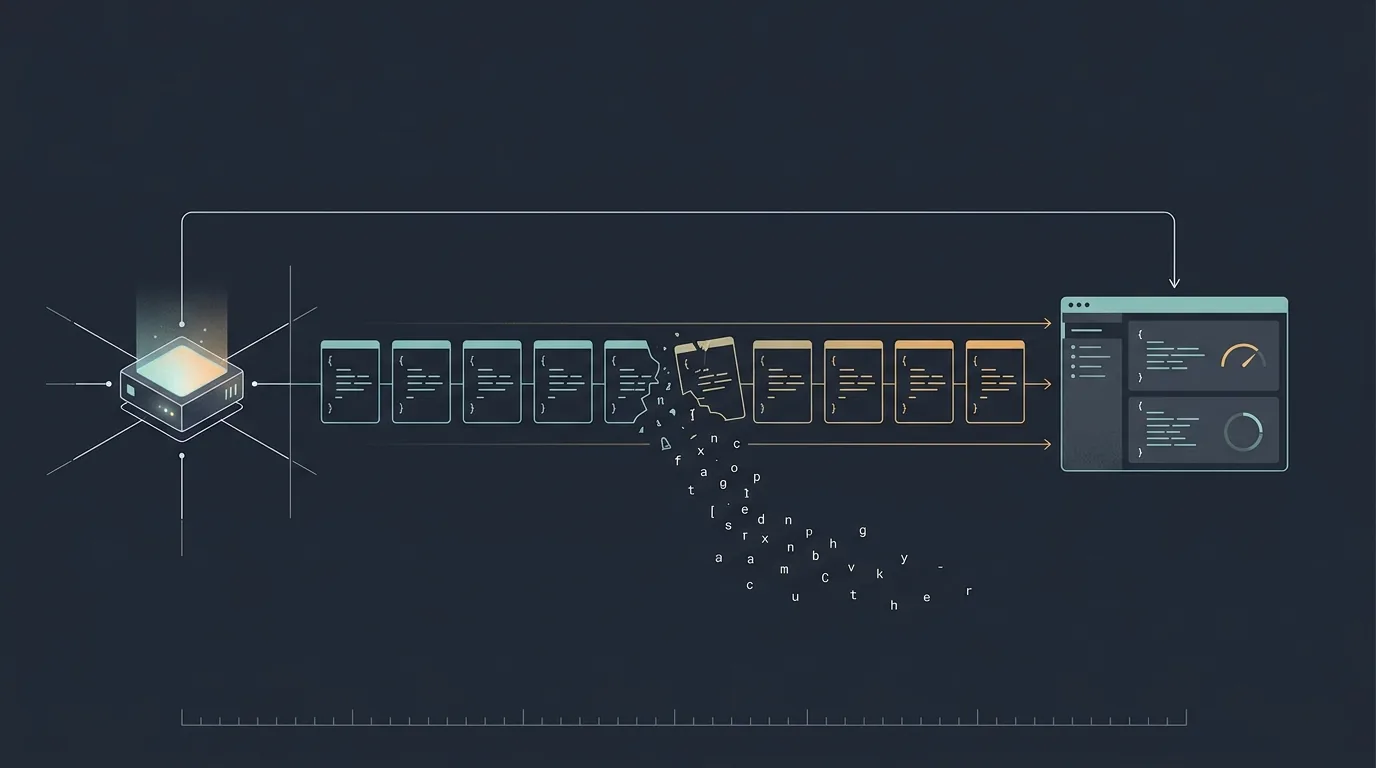
Every open-weight model card reports reasoning and coding scores. None report whether the model can still ask for a tool correctly once it has been shrunk to fit the hardware you own. That gap is where local agent setups quietly fail, and it takes an afternoon to measure.
By the founder of Cerevisor
Open-weight model cards report reasoning, coding, and agent scores. None report whether the model still produces a valid tool request at the compression settings a team actually deploys. That gap is where local agent setups fail, and it is measurable in an afternoon.
I ran a small measurement on our own system this morning, mostly out of curiosity.
Some background, because the rest rests on it. When an AI agent uses a tool, it does not click anything. It writes a small block of structured text naming the tool and its arguments, and the software around it runs the real thing. That block either parses cleanly or it does not. No partial credit, and no way for the agent to carry on without it.
Before any of that, the model has to be told which tools exist and what each expects. A default agent in Cerevisor gets 19 tools, and written out in the format every local model server speaks, those descriptions come to 17,296 characters. The full set of 30 comes to 25,501.
That is what the model reads and holds before it sees a single word of the actual job.
Nobody benchmarks that.
What 17,296 characters of tool descriptions buys before the task starts
The contents are not exotic. The largest single description is the browser tool at 2,215 characters. The rest are ordinary: a few fixed lists of allowed values, a few structures nested three levels deep, nothing a parser should find exciting.
It also goes out completely untouched. Our connector hands each description to the model server exactly as written, whether the thing on the other end is a frontier API or a 27-billion-parameter model running on someone’s desk. Simplifying per provider would mean maintaining two versions of the truth about what a tool does, which is its own category of bug. So the model gets the real thing. The question is whether it can answer in kind.
The benchmarks do not tell us. A model card reports what the model knows and how well it reasons. Not whether the compressed build still closes its brackets under a 17KB block of tool descriptions at turn nine.
Thirteen tool-calling bugs in four days across four model servers
Between 31 July and 3 August, thirteen separate tool-calling issues were opened across vLLM, SGLang, llama.cpp, and LM Studio. Those four are serving engines: the software that runs an open-weight model on hardware you control and exposes it over an API.
The shapes repeat in a way that gets familiar fast. The model produces a tool request and the server hands it back as ordinary chat text, so the agent sees a sentence where it expected an instruction. Or the request arrives correctly with streaming off and incorrectly with streaming on, so the same prompt behaves differently based on a setting nobody thought was meaningful. Or the server invents an identifier that its own formatting rules then reject.
Five of the thirteen are those three patterns: vLLM #50768 and #50512, SGLang #33324, llama.cpp #26359, and LM Studio #2227, the last of which fires on any request carrying tool descriptions at all.
The engines are working on it. llama.cpp shipped build b10227 on 2 August with a parser built for one specific model family. That is a healthy sign, and also a reminder of how this works: the code that interprets a model’s tool requests is written per model, per engine, and after the model ships.
DeepSeek released V4-Flash-0731 on 31 July, MIT licensed, reporting 70.3 on a tool-use benchmark called Toolathlon-Verified. MarkTechPost printed the caveat that matters more than the score: “All benchmark numbers are vendor-reported on an unreleased harness, run your own evals first.” A score from a test rig nobody else can run says little about a given team’s tools, hardware, and compression settings.
A compressed model does not get dumber in a way a leaderboard notices. It gets less reliable at the one thing an agent cannot proceed without.
Ollama tools, a quantized cache, and the model that stops mid-sentence
I went looking for a controlled benchmark of tool-call accuracy across quantization levels.
Quantization is the compression step that makes local models practical. A model ships with its internal numbers stored at high precision, and running it that way needs expensive hardware, so teams store those numbers more coarsely: 8 bits each instead of 16, or 4 instead of 8. The file halves, then halves again, and suddenly it fits on a card the company already owns.
What I wanted was simple: same model, same tools, 4-bit against 8-bit, measured only on whether the tool request parses.
It does not exist publicly, as far as I could establish. Quantization benchmarks by the dozen, function-calling leaderboards by the handful, no published intersection.
The closest public evidence is a bug report, and it points at a second kind of compression entirely. That distinction matters, and most write-ups blur it. Compressing the model’s weights is one setting. Compressing the KV cache is another. The KV cache is the model’s working memory of the conversation so far, and it grows with every token, so teams compress it to buy back room for longer conversations. It is the knob people reach for when context runs short, and it is nowhere near as well studied.
Ollama issue #17347, opened 23 July, documents that knob suppressing tool calls outright. The reporter’s description is precise: the model periodically stops generating, with no tool call, right after writing a stated-intent sentence ending in a colon. It announces what it is about to do and then stops. It writes “Let me check the file:” and nothing follows.
| KV cache setting | Observed failure |
|---|---|
| f16 (full precision) | No failures across comparable sessions |
| q8_0 (8-bit) | 3 of 7 turns stalled at roughly 50-52k tokens |
| q4_0 (4-bit) | Failed almost immediately at roughly 4.3k prompt tokens |
One user, one AMD box, seven turns. That is a bug report and not a benchmark, and I will not dress it up as one. But the direction lines up with what the weight-compression numbers hint at.
"MMLU-Pro drops 1.6 points at Int4 (70.24% to 68.66%). HumanEval drops 8 points"
Those are two standard tests: the first measures knowledge recall, the second measures writing working code. Recall loses 1.6 points under 4-bit compression. Code generation loses 8. Roughly five times the damage, on the skill that most resembles writing correctly structured text against a specification. Tool calling is measured by neither, but it is a far closer cousin to the coding test than the trivia one.
Compressing the weights and compressing the working memory are two separate settings, and most write-ups treat them as one. A team can run FP8 weights safely and still break tool calling by dropping the KV cache to 4-bit to buy back context room. Test the combination that will actually ship, not each setting on its own.
The workaround layer that exists only for local endpoints
Every system that talks to local models grows a quiet layer of accommodations. Ours is documented in code comments written the day each one was needed, which makes it a decent archaeological record.
Tool calls that arrive without the field saying which tool they belong to. Tool calls with no identifier at all, which the comment blames on fast local models behind Ollama, so we generate one ourselves. Malformed data frames during warm-up, skipped silently. Not one of those exists for a first-party API. Every single one was written for the local path.
Then there is the failure I am less pleased about. When a model returns tool arguments that are not valid structured text, our code wraps the broken string and passes it to the tool anyway, which then fails because the fields it needs are missing. No repair, no reparse, no retry at that layer. Recovery lives two levels up and it is blunt: a counter that gives up after two consecutive tool failures, and one retry that doubles the token budget and asks the agent to try again.
Two wasted turns and a retry, to recover from a missing closing bracket. On a frontier API it almost never fires. On a compressed 27B model at turn nine, it is the difference between a workflow that finishes and one that burns its budget apologizing.
The five-check pass before an agent meets a local endpoint
None of this makes local models a bad idea. H100 rental sat at a $3.52/hr average across 48 providers on 3 August, up about 12% since July 2025, so the economics that pushed teams to self-host have not softened. The point is narrower: the model card is not evidence about the thing that will break.
Here is the pass I would run. It takes an afternoon.
-
Measure the tool descriptions actually being sent
Write out one agent's tool definitions in the format the model server receives, and count the characters. If that number surprises anyone on the team, the model was never the first thing to fix.
-
Run 30 real tasks at the settings you plan to deploy, and score only whether the tool call worked
Not answer quality. Whether the request parsed, whether the arguments matched what the tool expects, whether required fields were present. One number, and the honest one.
-
Test weight compression and cache compression together
4-bit weights with a full-precision cache and 4-bit weights with a 4-bit cache are two different deployments. Run both.
-
Test late in the conversation, not at the start
The cache stalls appeared at 4.3k and 50k tokens, and the streaming faults show up only across multiple turns. A single-turn smoke test walks straight past both.
-
Search the serving engine's issue tracker for the model name plus "tool"
Thirteen issues in four days means the answer is probably already written down, often with a working version to roll back to.
If a team is wiring a local endpoint into an agent setup this week, our notes on running OpenAI-compatible and local models cover the connection details and the operational advice, including why sequential execution usually beats parallel waves on a single box. That page currently says nothing about tool calling. Given what this measurement turned up, that is the next thing I am fixing.
The reassuring part is how cheap the answer is. Thirty examples and an afternoon replaces a guess with a number. Most teams that get burned here were not careless. They tested the model, and the model was never the part that broke.
Sources
- DeepSeek Upgrades DeepSeek-V4-Flash-0731 with Major Agentic and Coding Gains - MarkTechPost, 2026-07-31
- llama.cpp release b10227: chat, add qwen3 specialized parser - ggml-org/llama.cpp GitHub Releases, 2026-08-02
- Quantized KV cache (q8_0/q4_0) causes model to stop generating mid-turn instead of emitting a tool call - ollama/ollama GitHub Issues #17347, 2026-07-23
- LLM Quantization: BF16 vs FP8 vs INT4 - AIMultiple, 2026-03-17
- Tool calls returned as assistant text instead of function_call - vllm-project/vllm GitHub Issues #50768, 2026-08-02
- NVIDIA H100 Cloud GPU Pricing - GetDeploying, 2026-08-03
Written by Kinan Hamwi, Founder of Cerevisor.